
lydia ayeni
Data Analyst
About Me
Hi!! I am Lydia Ayeni, and I am a Data Analyst.
I am good with data cleaning and transformation, data analysis, and data presentation. Proven to understand organization's requirements and translate them into feasible recommendations. I am dedicated and hard-working with interest in business growth and development.
Skills


SQL | Tableau | Excel | Power BI
Featured Projects
Power BI
Supply Chain Management
Interactive supply chain performance dashboard for a beauty line.

Excel
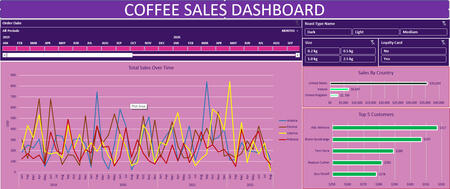
Coffee Sales Dashboard
Sales performance analysis for a coffee store with slicers and a 4 year duration timeline bar.
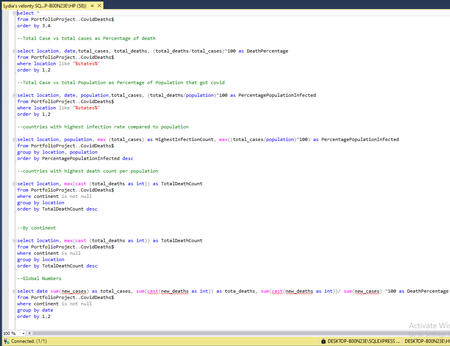
SQL
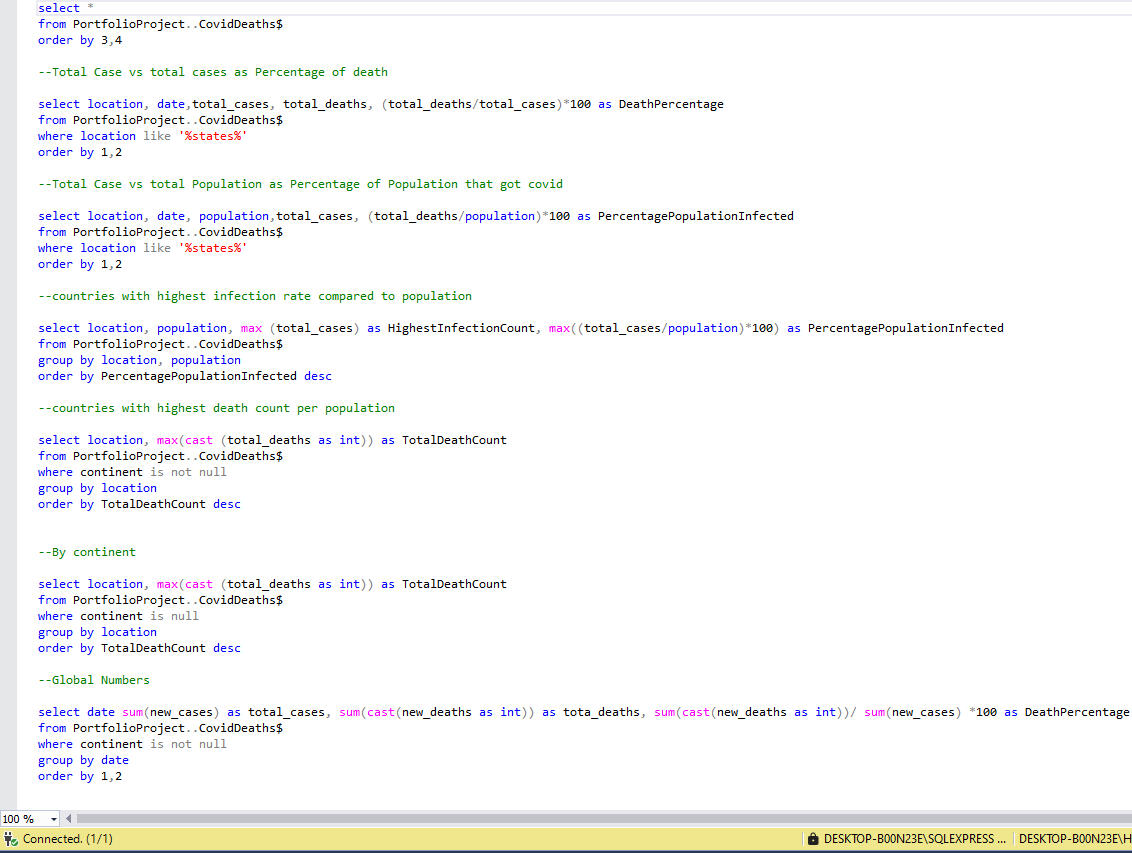
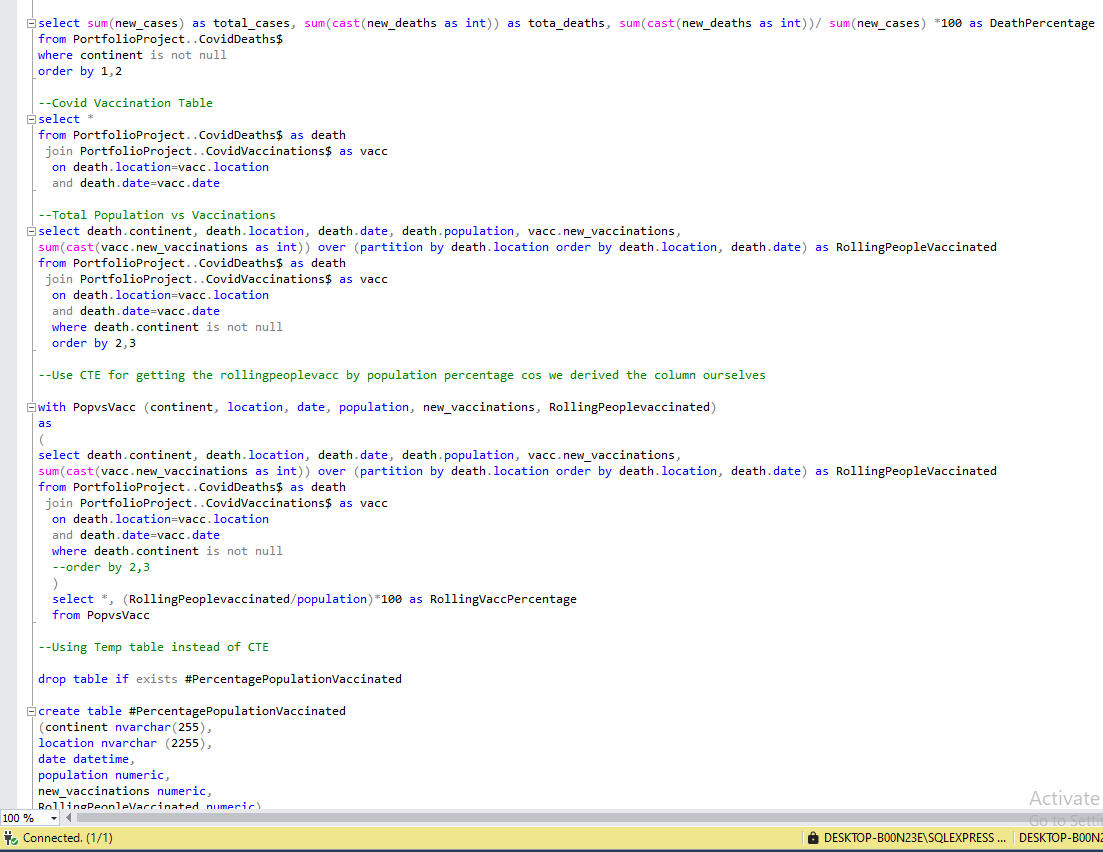
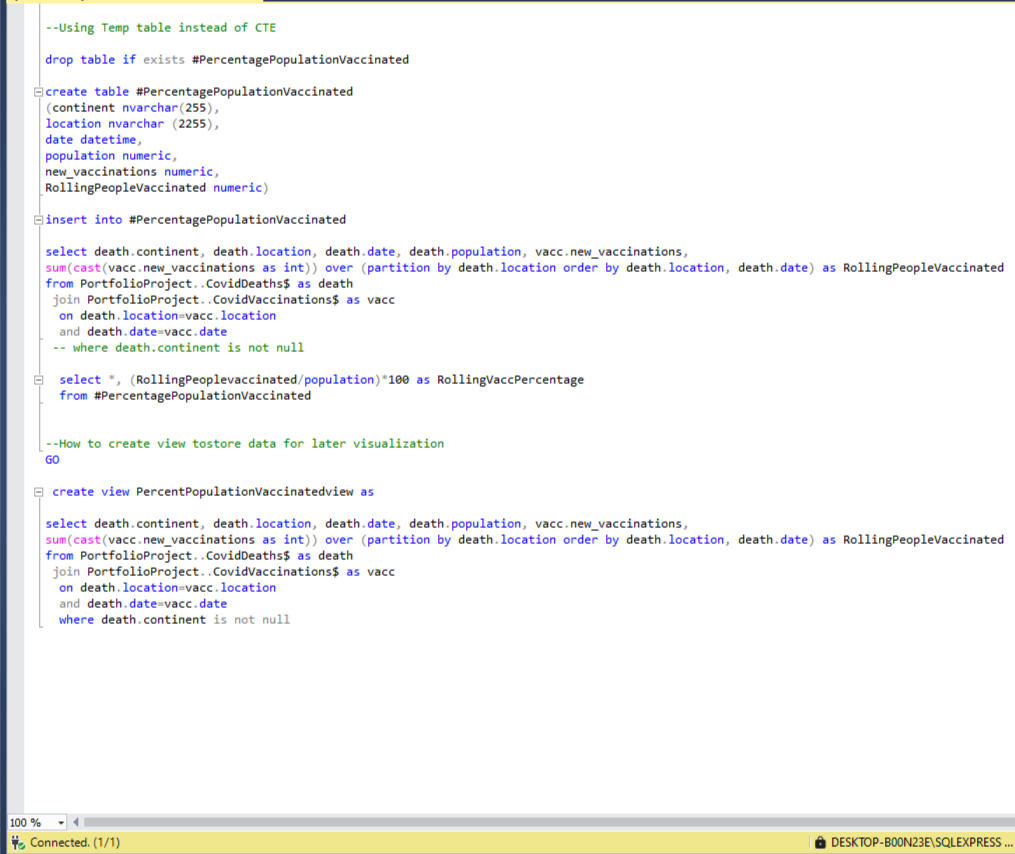
COVID DEATH AND VACCINATION ANALYSIS
Queried Covid death and vaccination dataset for 6 continents.
Power BI
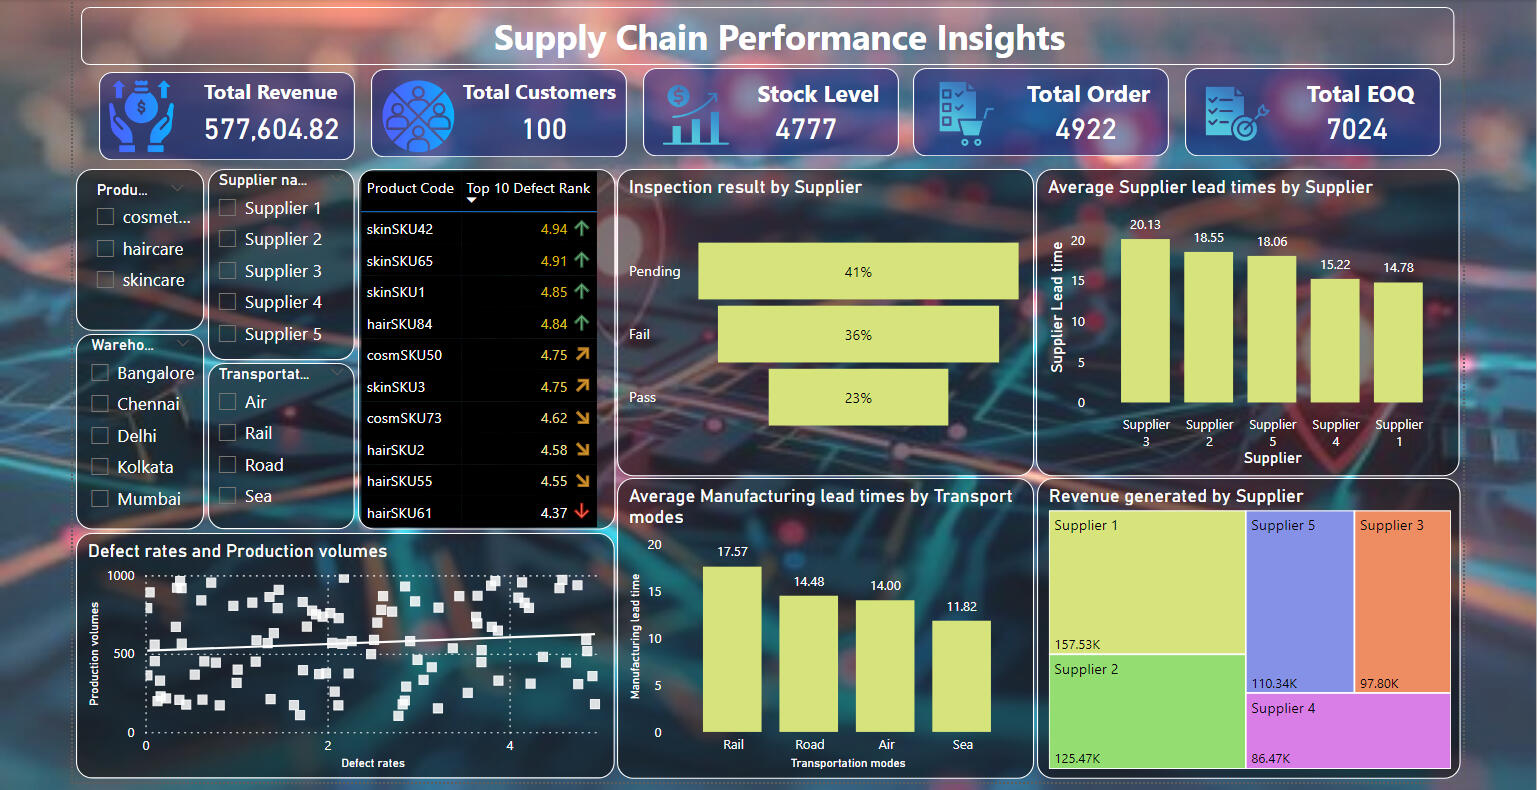
Supply Chain Management
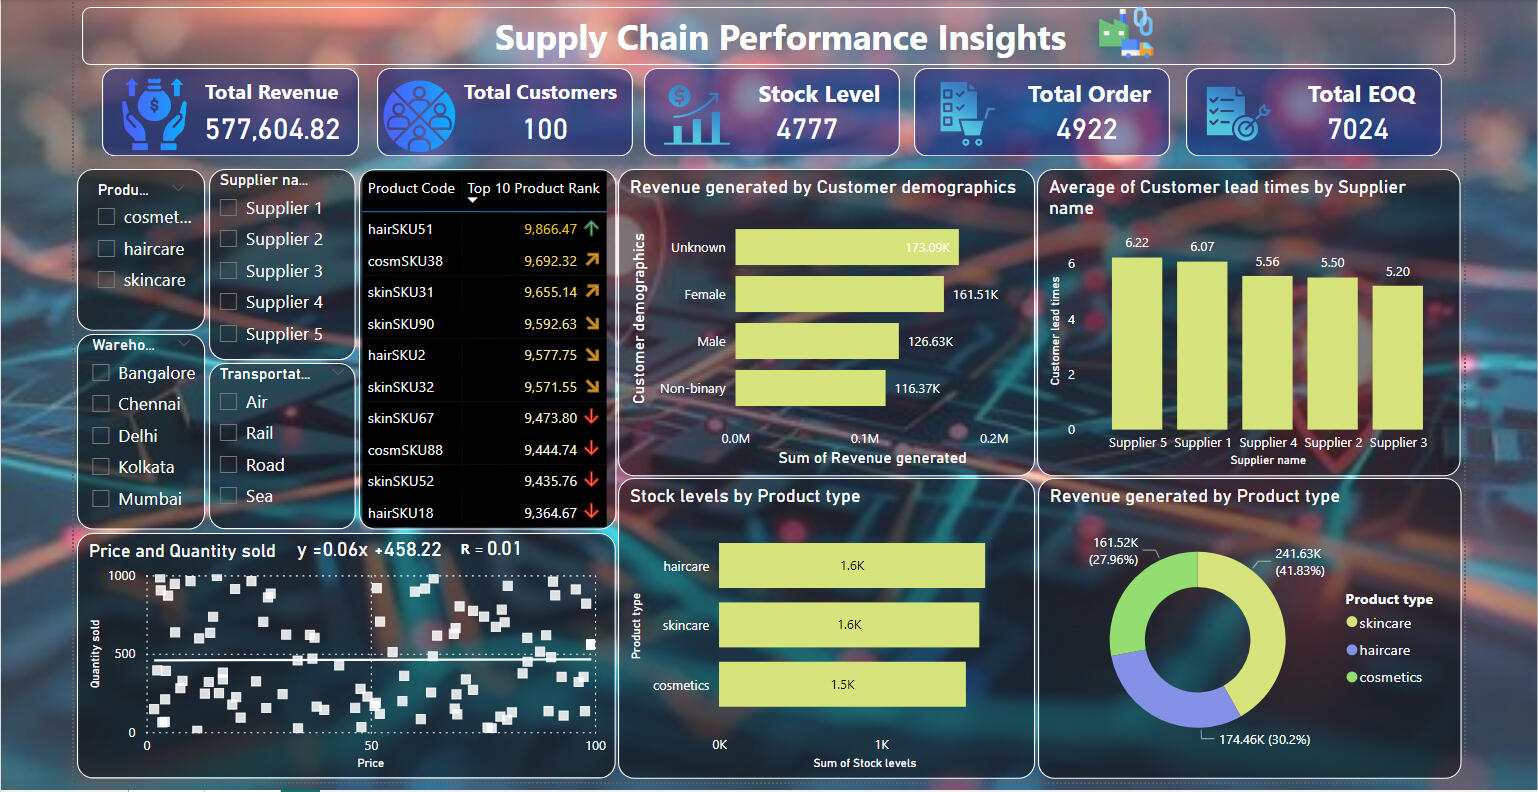
Here are the questions I was interested in answering:
1. How do inventory levels, lead times, and stock management practices impact product availability and sales performance?
2. What are the relationships between supplier performance, including lead times and defect rates, and overall supply chain efficiency?Here are the steps I took during my analysis to answer the questions:
1. I downloaded the data from kaggle and imported it to power BI.
2. I cleaned and transformed the data using Power Query Editor (remove duplicates, handle missing values).
3. I defined calculated columns and measures using DAX (Data Analysis Expressions).
4. I created visualizations by selecting appropriate chart types (bar charts, pie charts, etc.) for each data point.
5. I customized the visualizations by adjusting properties like colors, labels, titles, and legends. Apply filters and slicers to make the dashboard an interactive one.
6. I arranged and aligned visualizations to create a well arranged dashboard layout. I added elements such as images and title for better readability.Here are my key findings:
1. Impact of Inventory Levels, Lead Times, and Stock Management Practices; Stock Levels by Product Type: The stock levels for haircare and skincare products are higher (1.6K each) compared to cosmetics (1.5K), indicating differences in stock management practices. Customer Lead Times by Supplier: Lead times vary by supplier, impacting product availability and sales performance. Supplier 5 has the longest average customer lead time (6.22 days), while Supplier 3 has the shortest (5.20 days).2. Relationships Between Supplier Performance and Supply Chain Efficiency; Supplier Lead Times and Defect Rates: Supplier 3 has the longest lead times (20.13 days), where as Supplier 1 has the shortest (14.78 days). Defect rates also vary, with the highest defect rate for skinSKU42 and the lowest for hairSKU61. There is a positive relationship between production volume and defect rate according to the regression line.
Excel
Coffee Sales Dashboard
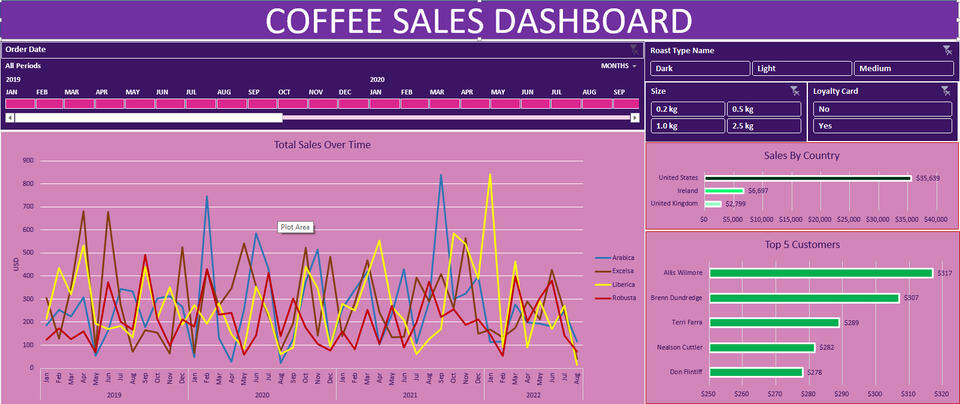
Here are the questions I was interested in answering:
1. What is the trend of total coffee sales over time?
2. How do sales vary by country?
3. What are the top-performing customer segments?Here are the steps I took during my analysis to answer the questions:
1. I downloaded the dataset and opened it using Microsoft excel. I cleaned and transformed the data using the Query Editor in excel (remove duplicates, handle missing values).
2. I defined calculated columns and measures using Query Editor.
3. I created visualizations by selecting appropriate chart types (bar charts, pie charts, etc.) for each data point with the help of pivot tables.
4. I customized the visualizations by adjusting properties like colors, labels, titles, and legends. Applied filters and slicers to make the dashboard an interactive one.
5. I arranged and aligned visualizations to create a well arranged dashboard layout. I added titles to the tables for better readability.Here are my key findings:
1. Sales show significant fluctuations over time with notable peaks in specific months, like December 2019 and March 2020.
2. The United States has the highest sales by a large margin compared to other countries like Ireland and the United Kingdom.
3. The top 5 customers, with Allis Wilmore contributing the most ($317), play a significant role in total sales.
SQL
COVID DEATH AND VACCINATION ANALYSIS
© Untitled. All rights reserved.